Special Needs Plans (SNPs) are Medicare Advantage (MA) plans that exclusively serve populations that have complex needs or are also enrolled in Medicaid. The enrollees in the 3 types of SNPs – Medicare-Medicaid dual eligible beneficiaries (D-SNPs), beneficiaries in institutional care (I-SNPs), or beneficiaries with specific chronic conditions (C-SNPs) – may benefit from the coordinated and patient-centered care that SNPs provide. Multiple factors affect SNP enrollment, including offering of SNPs and the size of the SNP-eligible population within a particular area. However, we hypothesize that states with a high MA penetration rate will have relatively high SNP enrollment and states with a large number of Medicare beneficiaries enrolled in traditional fee-for-service Medicare will have relatively low SNP enrollment.
Nearly 10% of all Medicare beneficiaries were enrolled in an SNP in 2023. Along with the growth in MA enrollment and alignment with Accountable Care Organizations (ACOs), there has been growth in both the number of SNPs offered and the number of Medicare beneficiaries enrolled in SNPs. Between 2021 and 2023, SNP enrollment increased from 6.3% (3.9M) of the Medicare-eligible population to 9.2% (6.0M).
Figure 1 shows the geographic variation in enrollment patterns in 2021 and 2023. In both years, the highest share of the Medicare population enrolled in SNPs was in the Southern states, with some moderate gains in the West from 2021 to 2023. The largest increases were in Mississippi (+10 percentage points (pp) with 17% of all Mississippi’s Medicare beneficiaries enrolled in a SNP in 2023), Louisiana (+6pp, 18% in 2023), and Arkansas (+6pp, 14% in 2023). These three states (and Vermont) also saw strong growth in MA enrollment. However, overall, SNP enrollment is growing at a faster pace (+52% between 2021 and 2023) than MA enrollment (+17%). For comparison, ACO enrollment grew only 3% between 2021 and 2022. (ACO enrollment in 2023 is not yet available on the CMS website.)
Figure 1: SNP Enrollment Growth (share of total Medicare enrollment), 2021 and 2023
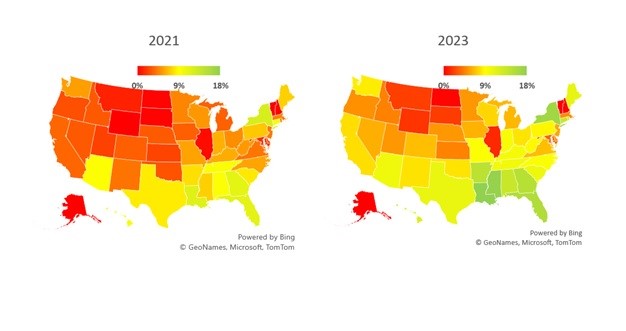
Note: Authors’ calculations. SNP data is suppressed for Alaska, Vermont, and Wyoming due counts <10. We imputed 0% SNP enrollment rate for these states.
Monthly SNP enrollment numbers are available on the website of the Centers for Medicare and Medicaid Services.
There is a positive relationship between SNP and MA enrollment, with 16.3% of all MA beneficiaries enrolled in SNPs in 2023. SNP enrollment and MA enrollment are positively correlated (i.e., the correlation coefficient of 0.55). However, states with close to 60% MA enrollment rates – Michigan, Minnesota, Rhode Island – have relatively low SNP enrollment, ranging between 5% and 7% in 2023. Nationally, 14% of all MA beneficiaries were in a SNP in 2021 and that proportion grew by 2 percentage points – to 16% – in 2023. While the share of MA beneficiaries enrolled in SNPs has grown over time (Figure 2), the correlation between MA penetration and the share of MA enrollees in a SNP is relatively low (0.27). There is no relationship between SNP enrollment and the number of Medicare beneficiaries aligned with ACOs.
Figure 2: Share of MA Beneficiaries enrolled in a SNP in 2023, by state

Note: Authors’ calculations. In 2021, SNP data are suppressed for Alaska, Vermont, and Wyoming and in 2023 for Alaska and Vermont due to counts <10. We imputed 0% SNP enrollment rate for these states.
Monthly SNP and MA enrollment numbers are available on the website of the Centers for Medicare and Medicaid Services.
Between 2021 and 2023, SNP enrollment has grown in absolute terms but in relative terms SNP growth exceeded that of MA non-SNP enrollment (52% or additional 2.1M beneficiaries in SNPs relative to 11% or additional 2.5M beneficiaries in MA plans that are not SNPs). Currently, there is broad variation in the MA penetration in the South ranging from 22% to 58%, with some southern states having 40-50% of their Medicare population enrolled in MA, of which at least one-third in Mississippi, Louisiana, and Arkansas and at least a quarter in Georgia and Florida were enrolled in SNPs.
The expanded reach of SNPs is potentially beneficial since these plans provide coordinated care for dual eligibles, institutionalized beneficiaries, and those with specific chronic needs. Given that the incidence of certain chronic illnesses is clustered predominantly throughout the southeastern region of the US, having a high proportion of Medicare population in managed care with a specialized focus could be crucial for improving health outcomes in the South.
Services : Blog, Payment Policy & Delivery System Innovation Expertise: Accountable Care Organizations, Medicare, Medicare Advantage

|
Inna Cintina is a Principal Research Associate in the Evaluation and Health Economics Practice. Dr. Cintina is an applied microeconomist with over a decade of research experience in the area of health economics. At KNG Health, Dr. Cintina is leading evaluations of the impact of managed care on high-need Medicare beneficiaries. Specifically, in work supported by a grant from Arnold Ventures, she is studying the distribution of high-need beneficiaries across enrollment types (Traditional Medicare, Accountable Care Organization (ACOs); and Medicare Advantage (MA)), healthcare services utilization and health outcomes in high-need beneficiaries attributed to ACOs relative to those in MA; and characteristics of MA plans associated with better health outcomes among enrollees. In other work, she studied disparities in utilization of new cardio- and neuro-vascular technologies and impacts of post-acute care settings on beneficiary outcomes. She is an expert in using matching techniques, difference-in-difference methodologies, and other quasi-experimental statistical approaches, as well as producing client-oriented materials, white papers, and manuscripts. She has authored/co-authored more than a dozen articles, which have been published in peer-reviewed journals such as World Bank Economic Review, Health Economics, JAMA, Value in Health, and the American Journal of Managed Care. Prior to joining KNG Health, Dr. Cintina worked at the Lewin Group/OptumServe and the University of Hawaii at Manoa. She has extensive experience in developing and implementing methodologies for identification of causal relationships, advanced analytics, project management, economic burden/cost of illness studies, and impact evaluations of alternative payment models, such as CMMI’s Bundled Payments for Care Improvement Initiative and Oncology Care Model. Dr. Cintina has a PhD in economics from Clemson University, a MSC in European Economics and Public Affairs from University College Dublin, and an MA and a BA in economics from the University of Latvia. |

|
Daniel Tshiani was formerly a Research Assistant in the Evaluation and Health Economics practice at KNG Health. |

|
Lane Koenig is President and Founder of KNG Health Consulting and Director of the Healthcare Reform and Payment Innovation Practice. He is a healthcare economist with over 20 years’ experience in the public and private sectors. As President of KNG Health Consulting, Dr. Koenig has overall responsibility for the quality and direction of KNG Health’s research. He serves as Project Director and Principal Investigator for many studies, particularly those related to healthcare reform proposals, healthcare provider payments, value-based purchasing, and delivery system innovations. With expertise on hospital and post-acute care payment and quality issues, his work regularly assesses the potential impact on hospitals and other providers of proposed legislation or regulations. He has assisted both industry and Federal and state governments in the development and assessment of healthcare provider payment policies and value-base purchasing initiatives. Prior to founding KNG Health in 2007, Dr. Koenig was the senior economist in the Office of Policy at the Centers for Medicare & Medicaid Services (CMS). Before joining CMS, Dr. Koenig was a Senior Scientist in the healthcare finance practice at The Lewin Group. Dr. Koenig has led over 100 quantitative and qualitative health policy and health economic studies and has published over 20 peer-reviewed studies in journals, such as Health Affairs, Health Services Research, and Medical Care. He graduated with Honors from the University of Florida, Gainesville and earned his PhD in Economics from the University of Maryland, College Park. |